Weld Lines in Injection Molding — Formation, Strength Loss, and How to Minimize Them
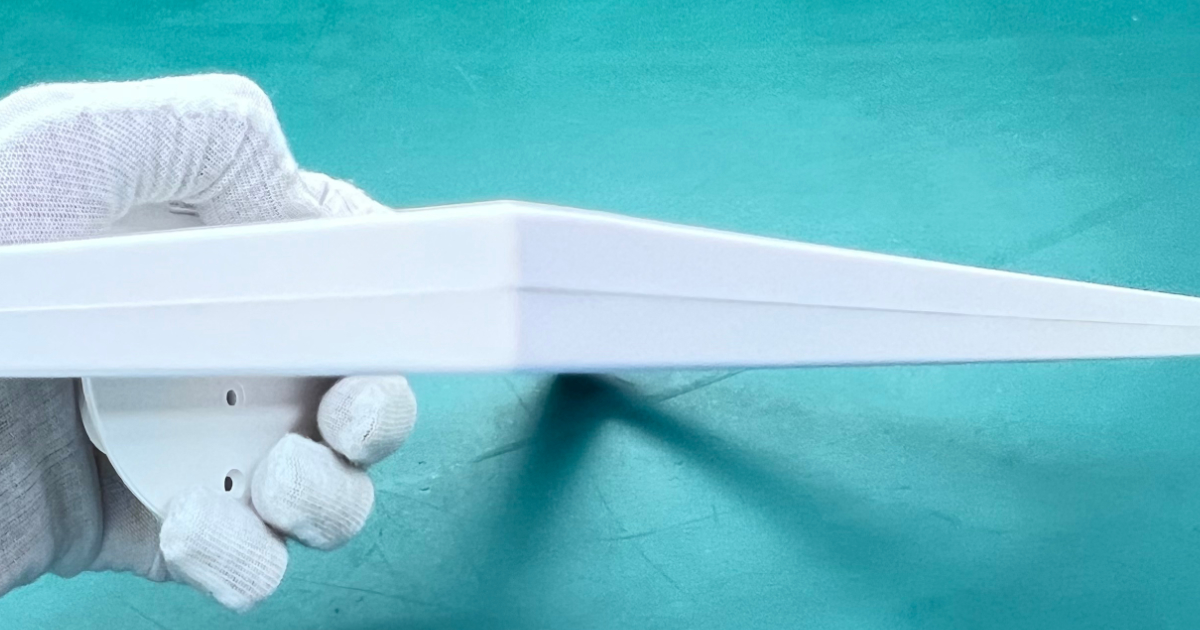
A product engineer at a medical device company is holding a failed burst-test housing. The part is a polycarbonate filter housing — 90 mm diameter, 3.0 mm wall, with a central core pin forming the internal cavity. The melt enters through a single edge gate and flows around the core pin, splitting into two flow fronts that meet on the opposite side. Under a 0.8 MPa hydraulic pressure test, the housing cracked at exactly the meeting point — a faint, hairline line visible on the surface, running axially along the part opposite the gate. The design specification called for a burst pressure of 1.2 MPa, with a safety factor of 1.5. The part failed at 55% of the target.
The failure mode was not a material defect. It was not a contamination problem. The part was fully filled, dimensionally in-spec, and cosmetically acceptable under diffuse light. The failure traced to a weld line — the plane where two melt fronts met, fused incompletely, and left a mechanically weakened zone. The weld line was predicted in the mold flow analysis but flagged as “low severity.” The analysis did not account for the burst-pressure loading condition that concentrated stress directly on the weld plane.
What a Weld Line Is — and What It Is Not
A weld line (also called a knit line) is the plane where two separate melt flow fronts converge and fuse during cavity filling. It forms whenever the melt stream divides and reunites — around a core pin, past an insert, through multiple gates, or across a thickness variation that splits the flow. At the meeting plane, the two flow fronts have cooled slightly during their travel, and the polymer molecules at each front surface have had limited time to diffuse across the interface and entangle before the material freezes.
A weld line is not a crack. It is not a void. It is a plane of incomplete molecular entanglement — a region where the polymer chains did not fully interdiffuse across the interface before solidification arrested the process. The result is a local reduction in mechanical properties: tensile strength, impact resistance, and fatigue life are all degraded at the weld plane. The strength reduction depends on the material, the processing conditions, and the geometry of the meeting angle.
Weld lines are distinct from meld lines (also called meld fronts):
| Feature | Weld Line | Meld Line |
|---|---|---|
| Meeting angle | <135° (flow fronts approach head-on or at an acute angle) | >135° (flow fronts approach nearly parallel, sliding past each other) |
| Molecular entanglement | Poor — chains oriented perpendicular to the interface | Better — chains oriented parallel to the interface, some entanglement possible |
| Strength retention | 40–80% of bulk material strength | 70–95% of bulk material strength |
| Visual severity | Usually visible as a surface line or notch | Often invisible or faint |
| Typical cause | Flow around a core pin, hole, or insert; meeting from two gates | Flow around a gradual contour; merging after a thickness transition |
The distinction matters because a meld line is typically 20–40% stronger than a weld line in the same material. When mold flow analysis predicts a weld line at a critical location, the designer’s first question should be: can the meeting angle be increased to convert this weld line into a meld line?
The Physics: Why the Interface Is Weak
When a molten polymer front advances through the cavity, the flow at the front is a fountain flow: material from the center of the melt stream is continuously conveyed to the walls, where it freezes against the cavity surface, while fresh material from behind replaces it at the flow front. The surface of each advancing flow front is continuously refreshed with hot material from the core of the melt stream.
When two flow fronts meet, the fountain flow stops. The two front surfaces — each carrying polymer molecules that have been exposed to the cavity air and have begun to cool — are pressed together by the incoming melt behind them. Molecular diffusion across the interface begins: polymer chains from one side migrate across the boundary and entangle with chains from the other side. This diffusion process is governed by the reptation model of polymer dynamics — chains move by snake-like motion along their own contour, and the time required for a chain to diffuse across the interface is proportional to the square of the chain length (molecular weight).
Two things limit the diffusion:
Cooling. The flow fronts have been traveling through the cavity, losing heat to the mold walls. By the time they meet, the skin temperature at each front surface may be 15–40°C below the melt temperature, and the viscosity at the interface is correspondingly higher. Higher viscosity means slower molecular diffusion. If the material at the interface drops below its glass transition temperature (Tg) or crystallization temperature (Tc) before sufficient entanglement has occurred, diffusion stops entirely, and the weld line is frozen in at its minimum strength.
Contamination. The flow front surfaces carry volatiles, mold release residues, and air that was trapped between the converging fronts. If the mold is not adequately vented at the weld line location, the trapped air prevents full contact between the two fronts and can oxidize the polymer at the interface, further degrading weld strength.
The strength of the resulting weld line is determined by the degree of molecular entanglement achieved across the interface during the time window between the fronts meeting and the material solidifying. A longer time window (higher mold temperature, higher melt temperature, shorter flow length before meeting) produces a stronger weld line.
Weld Line Strength — How Much Is Lost
The mechanical penalty of a weld line varies dramatically by material and loading mode. The general rule: weld line strength is 40–80% of the bulk material strength, but the range is wide and material-specific.
| Material | Tensile Strength Retention at Weld Line | Impact Strength Retention at Weld Line | Notes |
|---|---|---|---|
| ABS (general purpose) | 60–80% | 40–60% | Moderate retention; weld line often visually prominent on textured surfaces |
| PC (unfilled) | 70–85% | 15–40% | Good tensile retention but catastrophic impact loss — PC is notch-sensitive at weld lines |
| PC/ABS blend | 65–80% | 30–55% | Better impact retention than pure PC due to ABS rubber phase |
| PA6/66 (unfilled) | 55–75% | 30–60% | Weld line strength improves with moisture conditioning (plasticization aids molecular mobility) |
| PA6/66 (30% GF) | 35–55% | 20–40% | Glass fibers do not cross the weld interface; all load transferred through matrix only |
| PP (unfilled) | 70–90% | 60–85% | Excellent weld line strength — low Tg means extended molecular diffusion window |
| POM (acetal) | 40–60% | 25–45% | Poor weld line strength; rapid crystallization freezes the interface before entanglement completes |
| PBT (30% GF) | 35–55% | 20–35% | Similar to glass-filled nylon — fiber discontinuity at weld plane dominates strength loss |
| PEEK (unfilled) | 50–70% | 25–45% | Requires mold temperatures of 180–200°C for adequate weld line strength |
| LCP | 20–40% | 10–25% | Worst-case weld line material — rigid-rod molecules have minimal chain entanglement at any interface |
| TPE/TPU | 80–95% | 70–90% | Excellent weld line retention — low modulus and high molecular mobility enable near-complete healing |
The pattern is consistent: semicrystalline materials that crystallize rapidly (POM, PBT) and liquid crystal polymers (LCP) have the poorest weld line strength because crystallization or liquid-crystalline ordering at the interface prevents molecular entanglement. Amorphous materials with low Tg (PP, PC at elevated mold temperature) have the best weld line strength because the interface remains above Tg longer, allowing more diffusion.
The impact strength loss is almost always more severe than the tensile strength loss. A weld line acts as a notch — a plane of low cohesive strength — and impact loading concentrates stress at the notch tip. An unfilled polycarbonate part that retains 75% of its tensile strength at a weld line may retain only 20% of its impact strength. For parts subject to drop testing, snap-fit assembly, or impact loading, the weld line impact strength is the design-limiting property — not the tensile strength.
Five Levers for Managing Weld Lines
Lever 1: Gate Location and Number
The gate determines where the flow fronts divide and where they reunite. A single gate at one end of a part with a core pin forces the flow to split, travel around the pin, and meet on the opposite side — creating one weld line at the meeting plane. Two gates on opposite sides create two weld lines, each where the flows from the two gates meet. Multiple gates multiply the number of weld lines: four gates on a rectangular part create up to four weld lines, one at each flow-front meeting boundary.
The gate design strategy for weld line management has three priorities:
- Move the weld line away from the high-stress region. If the part has a known load path — a snap-fit arm, a boss that carries a fastener load, a pressure-bearing wall — the gate should be positioned so the weld line falls in a low-stress region.
- Minimize the flow length before the fronts meet. The shorter the distance from the gate to the meeting plane, the hotter the flow fronts when they converge, and the more time available for molecular diffusion before freezing. A weld line 15 mm from the gate is stronger than a weld line 80 mm from the gate.
- Minimize the number of weld lines. Fewer gates mean fewer weld lines. Use the minimum number of gates that achieves adequate filling — not one more.
Lever 2: Mold and Melt Temperature
Higher temperatures extend the molecular diffusion window. A hotter mold keeps the interface above Tg longer; a hotter melt delivers more thermal energy to the meeting plane, keeping the material at the flow front surface hotter during the travel from the gate to the meeting point.
The quantitative effect is material-specific:
| Parameter Change | Typical Weld Line Strength Improvement | Mechanism |
|---|---|---|
| Mold temperature +20°C | 5–15% | Slower cooling at interface → more diffusion time |
| Melt temperature +20°C | 5–10% | Hotter flow front at meeting point → lower viscosity at interface |
| Mold + melt both +20°C | 10–25% | Combined effect — hottest interface for the longest time |
The practical limit is cycle time: every 10°C increase in mold temperature adds approximately 8–15% to the cooling time, depending on the part wall thickness. The cost of the extended cycle must be weighed against the cost of a weld line failure — in a medical or automotive application where weld line failure is a safety risk, the cycle time increase is justified.
Lever 3: Injection Speed
Faster injection delivers hotter melt to the flow fronts — less heat loss during cavity filling means hotter material at the meeting plane. The weld line strength improvement from increased injection speed is typically 5–15%.
However, injection speed has a competing effect: faster injection also increases the shear heating in the melt, which can degrade the polymer if the shear rate exceeds the material’s critical shear rate. And in poorly vented molds, high injection speeds can trap air at the weld line, oxidizing the polymer at the interface and degrading weld strength beyond what the hotter melt gains.
There is an optimal injection speed for weld line strength — fast enough to minimize heat loss during filling, slow enough to allow air to escape through the vents before the fronts meet. This optimum is mold-specific and is typically found through a scientific molding study: mold parts at increasing injection speeds, cut tensile bars across the weld line, test to failure, and plot weld line strength against injection speed.
Lever 4: Venting at the Weld Line
When two flow fronts converge, the air between them must escape somewhere. If the mold is not vented at the weld line location, the trapped air is compressed between the converging fronts, heats adiabatically, and can cause a diesel effect — burning the polymer at the interface and leaving a visible burn mark and a mechanically worthless weld.
A properly vented mold at the weld line location has a vent groove — typically 0.02–0.03 mm deep for unfilled materials, 0.01–0.015 mm for low-viscosity materials like PA6 — perpendicular to the weld line, allowing the entrained air to escape into the vent channel rather than being trapped at the interface. The vent location is determined by the mold flow analysis: the simulation predicts the exact meeting plane of the flow fronts, and the vent is machined at that location.
For parts where the weld line location cannot be moved and the mechanical requirements are stringent, a overflow well — a small cavity connected to the weld line by a thin gate, located beyond the vent — can improve weld strength by 10–20%. The overflow well receives the contaminated front-surface material, pulling it away from the weld plane and allowing cleaner, hotter material from behind the fronts to form the weld. The overflow is trimmed after molding.
Lever 5: Material Selection
When geometry and processing have been optimized and the weld line strength is still below the requirement, the material choice is the remaining lever. The options, in order of effectiveness:
- Switch to a material with higher weld line strength retention. From the table above: unfilled PP and TPE/TPU have excellent retention; unfilled PC has good tensile retention but poor impact retention; glass-filled materials and LCP have poor retention. If the application permits, switching from POM (40–60% retention) to unfilled PA6 (55–75% retention) can increase the weld line strength by 20–30 percentage points.
- Reduce or eliminate the fiber content. Glass fibers do not cross the weld interface — they act as stress concentrators at the weld plane. An unfilled grade of the same polymer typically has 20–40 percentage points higher weld line strength retention than the 30% GF version. The trade-off is reduced stiffness and strength in the bulk material.
- Use a higher molecular weight grade. Higher molecular weight (lower melt flow rate) means longer polymer chains, which require more time to diffuse across the interface — but once entangled, produce a stronger weld line. A PC with MFR of 10 g/10min typically produces 10–15% higher weld line strength than the same PC with MFR of 22 g/10min, all other parameters equal.
Mold Flow Analysis for Weld Line Prediction
Mold flow simulation predicts weld line locations with high accuracy — the fill simulation tracks the position of every flow front at every time step, and the meeting of two flow fronts is a direct output of the calculation. The simulation outputs a weld line map: a set of lines on the part surface showing where flow fronts meet.
The simulation also calculates the meeting angle at every point along the weld line, allowing the designer to distinguish weld lines (<135° meeting angle) from meld lines (>135°). A weld line with a meeting angle of 90° (flow fronts meet head-on) is the worst case; a meld line with a meeting angle of 160° (fronts slide past each other nearly parallel) is the best case.
What standard mold flow analysis does not typically provide is a quantitative weld line strength prediction. The simulation predicts where the weld line will be; it does not predict how much weaker it will be than the bulk material. Specialized weld line strength modules exist (Moldflow’s “Fiber Orientation” module combined with structural FEA can predict anisotropic mechanical properties including weld line effects), but the standard fill + pack simulation only provides weld line location and meeting angle.
The designer’s workflow: run the fill simulation, identify weld line locations, check whether any weld line falls on a high-stress region, and if so, iterate on the gate location or part geometry to move or eliminate it. Do not rely on the simulation’s “severity” flag alone — a weld line flagged as “minor” in a cosmetic context may be a fracture initiation site under mechanical loading.
When a Weld Line Cannot Be Eliminated
Some part geometries make weld lines unavoidable: any part with a through-hole, a core pin, an insert, or multiple gates will have weld lines somewhere. The engineering question is not whether the part has weld lines — it is whether the weld lines are strong enough for the loading condition, and whether they are in an acceptable location.
When a weld line cannot be eliminated, four approaches reduce the risk of field failure:
- Validate with testing, not simulation. Mold tensile bars or representative test plaques with the same gate configuration as the production part, and test the weld line strength directly — tensile, impact, and fatigue. Simulation predicts location; testing predicts performance.
- Design the part to direct the load path away from the weld line. Add ribs, gussets, or wall thickness increases that steer the primary stress path around the weld plane. The weld line is still there; it is simply not carrying the primary load.
- Add an overflow well at the weld line — as described in Lever 4 — to improve weld strength by pulling contaminated front-surface material away from the interface.
- Post-mold annealing. Heating the part to 10–20°C above the material’s HDT (heat deflection temperature) for 1–4 hours allows additional molecular diffusion across the weld interface. Annealing can improve weld line strength by 10–25% in amorphous materials. In semicrystalline materials, the improvement is smaller (5–10%) because annealing primarily affects the amorphous phase.
The medical device engineer who started with the burst-test failure at the polycarbonate filter housing ultimately addressed it through gate relocation and a material change. The original single edge gate was moved to a diaphragm gate at the center of the part — a circular gate that feeds the melt radially outward from the center, eliminating the core-pin flow split entirely. The weld line moved from a single axial line opposite the gate (carrying the full hoop stress of the pressure test) to a circumferential ring at the base of the part (a low-stress region). The material was switched from standard PC to a higher molecular weight PC grade (MFR 8 vs. the original MFR 15), improving weld line strength by an additional 12%. The revised part passed the 1.2 MPa burst test with a 1.5× safety factor, reaching failure at 1.9 MPa — 2.4× the original failure pressure.
Weld lines are not a process defect that can be “dialed out” by the molding technician. They are a consequence of the part geometry, the gate location, and the melt flow path. The time to address them is during mold design, when the gate location can be chosen to place weld lines in low-stress regions — or eliminate them entirely by choosing a gating strategy that avoids splitting the melt front.