Warpage in Injection Molding — Root Causes, Prediction, and How to Fix It
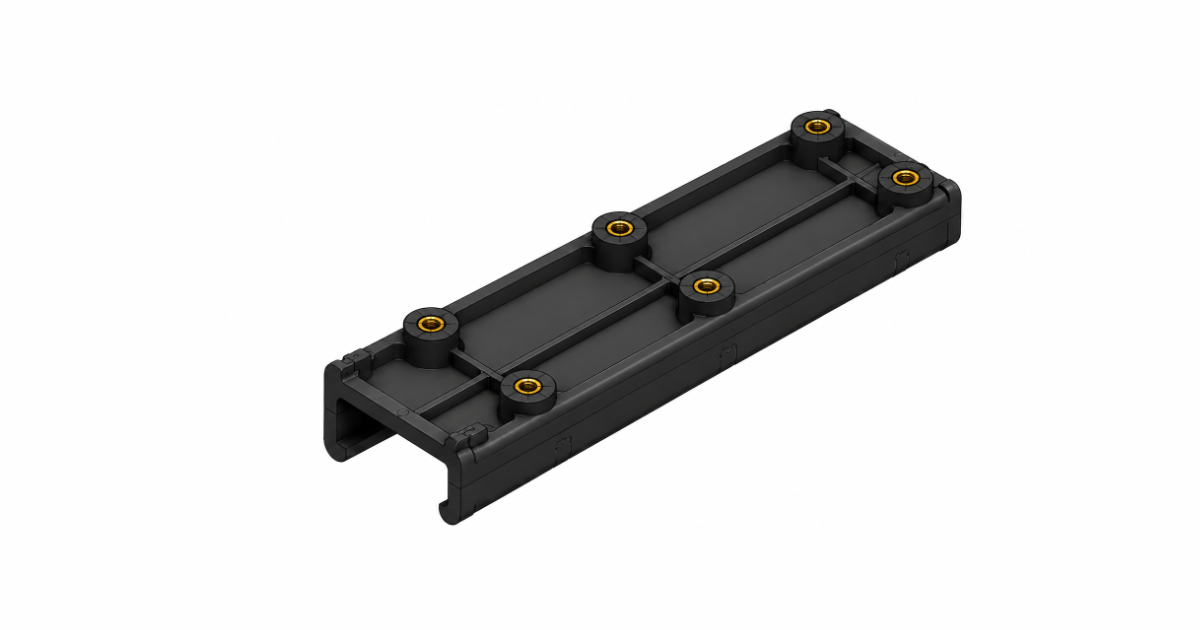
A quality manager at an automotive supplier is reviewing the dimensional report for a glass-filled nylon 6/6 bracket — 220 mm long, 45 mm wide, 3.5 mm wall, with a U-channel cross-section and six M6 mounting bosses. The customer’s drawing specifies a flatness tolerance of 0.4 mm across the 220 mm length. The CMM report shows measured flatness deviation of 1.2 mm — three times the tolerance. The part bows upward in the center by over a millimeter, pulling the two end mounting surfaces out of plane. The mold has been in production for two weeks. The process has been adjusted — mold temperature raised, cooling time extended, injection speed varied — and the flatness deviation has moved from 1.2 mm to 1.1 mm to 1.3 mm, but never below 1.0 mm. The quality manager has a shipment due in three days and a tool that cannot produce an in-tolerance part.
Warpage is the most difficult injection molding defect to diagnose because it has four independent root causes, each producing a similar visual result — a part that is not flat — but requiring a different corrective action. Treating a fiber-orientation warpage problem with a cooling adjustment not only fails to fix it; it often makes it worse by shifting the warpage pattern without addressing the underlying mechanism.
The Four Root Causes of Warpage
Warpage is the macroscopic distortion of a molded part from its intended shape. Unlike sink marks — which are localized surface depressions — or short shots — which are incomplete filling — warpage is a global shape error. The part is fully filled, fully packed, and cosmetically acceptable. It is just not the right shape.
Every warped part traces back to one or more of four mechanisms:
| Root Cause | What Happens | Diagnostic Signature |
|---|---|---|
| Differential cooling | One surface cools faster than the opposite surface → asymmetric thermal contraction → bending toward the hotter side | Symmetric part geometry; warpage direction correlates with mold temperature differential |
| Fiber orientation | Glass or carbon fibers align in the flow direction → anisotropic shrinkage (low in flow direction, high transverse) → differential contraction | Occurs in filled materials; warpage pattern follows the flow path from the gate |
| Non-uniform shrinkage | Different regions of the part shrink at different rates due to thickness variation, packing pressure decay, or crystallinity gradients | Warpage concentrated at thick-to-thin transitions; packing pressure changes affect warpage magnitude |
| Asymmetric filling | The melt front reaches different regions of the cavity at different times → asymmetric pressure distribution → asymmetric shrinkage | Occurs in single-gated parts with asymmetric geometry; pattern changes with gate location |
A single part can have all four mechanisms operating simultaneously. The diagnostic skill is identifying which mechanism is dominant — because the corrective action for one mechanism is often irrelevant or counterproductive for another.
Mechanism 1: Differential Cooling — The Hot Side Bends
When the two surfaces of a part cool at different rates, the surface that cools more slowly shrinks more after ejection. The result: the part bends toward the hotter side.
The mechanism: during molding, the plastic against the cavity wall freezes first, forming a solid skin. The core of the wall remains molten and cools more slowly. In a well-designed, symmetrically cooled mold, both surfaces of the part freeze at approximately the same rate, the core shrinks uniformly toward the centerline, and the part remains flat.
When the mold surfaces are at different temperatures — the core side at 75°C and the cavity side at 50°C, a 25°C differential — the plastic against the colder cavity surface freezes faster and develops a thicker, stiffer skin. The plastic against the hotter core surface remains molten longer, develops a thinner skin, and continues to shrink after the cavity-side skin has already solidified. When the part is ejected, the core side — which cooled more slowly — undergoes additional post-ejection shrinkage while the cavity side is dimensionally stable. The differential post-ejection shrinkage bends the part toward the hotter side.
The cooling rate differential is determined by the cooling system design: the distance from the cooling channel to the cavity surface, the coolant flow rate, the channel diameter, and the circuit layout. A mold where the core has two 8 mm channels at 25 mm standoff distance and the cavity has four 12 mm channels at 15 mm standoff distance will always produce a core-side surface temperature 10–20°C hotter than the cavity side — and the part will warp toward the core.
Diagnostic test: Measure the cavity and core surface temperatures with a contact thermocouple during a short-shot trial. A differential greater than 10°C on an amorphous material or 15°C on a semicrystalline material is likely to produce measurable warpage. If the warpage direction correlates with the hotter side, differential cooling is the dominant mechanism.
Corrective action: Balance the cooling. Reduce the core-side cooling channel standoff distance, increase the core-side flow rate, or add baffles/bubblers to the core. The goal is to bring the core and cavity surface temperatures within 5–8°C of each other. Independent temperature control for core and cavity — with the core set 5–10°C cooler than the cavity to compensate for the core’s inherently higher heat load — is standard practice.
Mechanism 2: Fiber Orientation — The Flow-Path Spring
Glass and carbon fibers align in the direction of melt flow during cavity filling. In the flow direction, the fibers constrain the polymer matrix, reducing shrinkage to approximately 0.1–0.3% for a 30% glass-filled material. Transverse to the flow direction, the fibers provide no constraint, and the shrinkage is 3–5× higher — typically 0.5–1.0%.
When a part is gated from one end, the flow is predominantly in one direction along the part length. The shrinkage in the flow direction (along the length) is low; the shrinkage transverse to flow (across the width) is high. The differential shrinkage creates a bending moment: the part wants to shrink more in the width direction than in the length direction, but the geometric constraint of the part shape forces it to curve rather than shrink freely.
The fiber orientation effect is independent of cooling uniformity. A perfectly cooled mold — core and cavity at identical temperatures — will still produce a warped part in a glass-filled material if the fiber orientation produces anisotropic shrinkage. The warpage pattern follows the flow path: if the flow is radial from a center gate, the part warps symmetrically. If the flow is linear from an end gate, the part curves along the flow direction.
Diagnostic test: Mold the same part geometry in the unfilled and glass-filled versions of the same polymer. If the warpage is present in the filled version but absent (or significantly reduced) in the unfilled version, fiber orientation is the dominant mechanism. Alternatively, a mold flow analysis with fiber orientation prediction will show the orientation tensor in the part — regions where the orientation is highly aligned in one direction will exhibit anisotropic shrinkage.
Corrective action: Three approaches, in order of effectiveness:
- Change the gate location. A gate that produces radial flow (center gate on a disk) or balanced flow from two sides (dual edge gates) creates a more symmetric fiber orientation pattern than a single end gate. The symmetry reduces the net bending moment.
- Reduce the glass fiber content if structurally permissible. Moving from 30% GF to 15% GF reduces the anisotropy by approximately 40–50%.
- Increase the mold temperature. A hotter mold (90–110°C for glass-filled nylon, versus the standard 70–85°C) allows the polymer matrix to relax some of the orientation stress before freezing. The trade-off is a longer cooling time.
Mechanism 3: Non-Uniform Shrinkage — The Thickness Effect
Different regions of a part shrink at different rates when the wall thickness is not uniform, the packing pressure decays with distance from the gate, or the cooling rate varies across the part. A thick section shrinks more than a thin section because there is more material to contract. A region far from the gate receives less packing pressure than a region near the gate, and the lower packing produces higher shrinkage because less material was forced into the cavity to compensate for thermal contraction.
The wall thickness design is the first line of defense against non-uniform shrinkage warpage. A part with a uniform 2.5 mm wall shrinks uniformly. A part that transitions from 2.0 mm to 4.0 mm at a boss or a rib root will shrink non-uniformly — the thick section shrinks more, pulling the adjacent thin section with it, creating a local warp at the transition.
Packing pressure decay is the second contributor. The hold pressure at the gate may be 80 MPa, but the pressure at the far end of a 250 mm flow path may be 25–35 MPa after the pressure drop through the cavity. The near-gate region is well-packed and shrinks less; the far-gate region is poorly packed and shrinks more. The differential shrinkage across the part length produces a bowing toward the poorly packed side.
Diagnostic test: A gate-seal study — weigh parts molded at increasing hold times and plot weight against hold time. If the part weight continues to increase with hold time beyond the normal gate-seal time, the far regions of the cavity are not receiving adequate packing before the gate freezes. A mold flow analysis with packing simulation predicts the pressure distribution at the end of packing — regions where the pressure drops below 20–30 MPa are at risk of elevated shrinkage.
Corrective action:
- Uniform wall thickness. Eliminate unnecessary thickness variations. Where thick sections are unavoidable, transition gradually (a 3:1 taper over at least 5 mm).
- Add gates or move the gate. Additional gates reduce the flow length and the packing pressure drop. A second gate at the far end of the part cuts the maximum flow length in half.
- Increase the hold pressure and hold time — but only after verifying that the gate is not freezing prematurely. If the gate freezes before the far regions of the cavity are packed, no amount of hold pressure helps.
Mechanism 4: Asymmetric Filling — The Unbalanced Flow Front
When the melt front reaches different regions of the cavity at different times, the regions filled first begin to cool and shrink while the regions filled last are still receiving melt and are at a higher pressure. The result is an asymmetric stress distribution frozen into the part when it solidifies — one side of the part was packed under high pressure and shrinks less; the other side was packed under lower pressure and shrinks more.
Asymmetric filling is most common in parts with a single edge gate and an asymmetric geometry — a rectangular part gated near one corner, a part with a large variation in wall thickness that steers the flow front, or a family mold with dissimilar part sizes.
Diagnostic test: Short-shot progression — mold parts at incrementally increasing shot sizes (60%, 70%, 80%, 90%, 95% of full shot) and observe the flow front position at each increment. An asymmetric filling pattern is visible as a flow front that reaches one extremity of the cavity before another.
Corrective action:
- Change the gate location to produce symmetric filling. A center gate on a rectangular part produces symmetric flow to all four sides.
- Add flow leaders or flow restrictors. A locally thicker wall acts as a flow leader — it accelerates the flow front in that direction. A locally thinner wall acts as a flow restrictor. Adjusting the wall thickness by ±0.2–0.3 mm in specific regions (with customer approval) can balance an asymmetric fill pattern without moving the gate.
Mold Flow Analysis for Warpage Prediction
Warpage is the most computationally demanding mold flow simulation output because it requires all three preceding analyses — fill, pack, and cool — to be accurate. A warpage prediction is only as good as the inputs to the fill (material viscosity data), pack (PVT data for the material), and cool (mold steel thermal conductivity and cooling channel layout) simulations.
The simulation outputs a warpage magnitude and a deformed shape — a 3× magnified visualization of the predicted post-ejection distortion. The designer compares the predicted warpage to the part’s flatness or dimensional tolerance. A predicted warpage of 0.8 mm on a part with a 0.5 mm flatness tolerance is a red flag before steel is cut.
The simulation also identifies which mechanism is dominant. A warpage analysis that includes fiber orientation will attribute the warpage to orientation effects, differential cooling, or non-uniform shrinkage, and the designer can address the dominant mechanism rather than guessing.
Process vs. Design — What Can Be Fixed After the Mold Is Built
| Root Cause | Design Fix (mold not yet built) | Process Fix (mold already built) |
|---|---|---|
| Differential cooling | Redesign cooling circuit | Increase coolant flow rate; independent TCU for core/cavity; reduce coolant temperature |
| Fiber orientation | Move gate; change fiber content | Increase mold temperature; reduce injection speed to reduce orientation |
| Non-uniform shrinkage | Uniform wall thickness; add gates | Increase hold pressure/time (up to gate-seal limit) |
| Asymmetric filling | Move gate to center; balance flow path | Adjust melt temperature (hotter = lower viscosity = more uniform fill); adjust injection speed profile |
Once the mold is built, the process fixes are compensatory — they reduce the warpage magnitude but rarely eliminate it. The time to eliminate warpage is during mold design, when a mold flow analysis with warpage prediction can identify the dominant mechanism and the designer can choose a gate location, cooling layout, and wall thickness distribution that produce a flat part from the first shot.
The automotive supplier’s quality manager eventually identified the dominant mechanism through mold flow analysis: fiber orientation from the end gate was producing 0.9 mm of warpage due to anisotropic shrinkage in the glass-filled nylon. Differential cooling from an under-cooled core was adding 0.4 mm. The combined 1.3 mm matched the measured 1.2–1.3 mm.
The process fix — raising core coolant flow rate to bring the core within 6°C of the cavity — reduced the differential cooling contribution to 0.1 mm, bringing the total warpage to 1.0 mm. Still above the 0.4 mm tolerance. The design fix — adding a second gate at the opposite end of the part to create symmetric flow and balanced fiber orientation — required a mold modification (new gate insert, runner rebalance) costing approximately ¥8,000 and taking five days. The warpage after the modification: 0.28 mm. Within tolerance.
Warpage is not a mystery. It is a predictable consequence of the physics of plastic solidification. The diagnostic skill is identifying which of the four mechanisms is dominant; the engineering skill is choosing the correction that addresses the mechanism rather than its symptom.