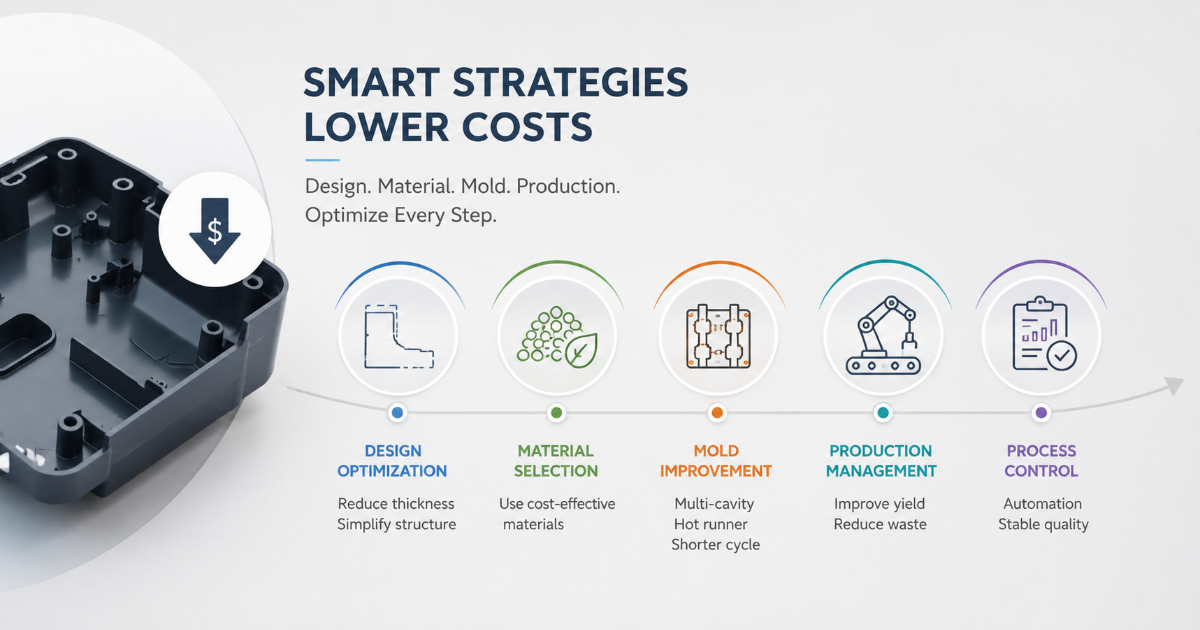
Plastic Part Cost Reduction — Design, Process, and Tooling Strategies That Lower Per-Unit Cost
A procurement engineer at a contract manufacturer receives a cost-down target: reduce the per-unit cost of a molded ABS electronics enclosure from ¥6.20 to ¥4.80 — a 23% reduction — without changing the part’s external dimensions, the customer’s cosmetic specification, or the annual volume of 120,000 units. The current part runs in a two-cavity cold-runner mold on a 200-tonne press at a 38-second cycle time. The material is a general-purpose ABS at ¥18/kg. The part weighs 45 grams, and the cold runner adds 18 grams per shot — 40% of the shot weight is lost to the runner.
The procurement engineer’s first call was to the material supplier, asking for a price reduction on the ABS. The supplier offered a 5% discount for an annual volume commitment — from ¥18/kg to ¥17.10/kg. That reduces the per-unit cost by ¥0.04. The target requires a ¥1.40 reduction.
The solution is not cheaper material. It is a cheaper process.
Where the Cost Is — A Per-Part Cost Breakdown
A typical injection molded part’s cost is dominated by material and machine time, not by the mold amortization:
| Cost Element | Typical Share of Per-Unit Cost | What Drives It |
|---|---|---|
| Material | 40–60% | Part weight, material price, runner waste, regrind percentage |
| Machine time | 25–40% | Cycle time, press hourly rate, cavitation |
| Labor | 5–15% | Operator requirement, degating, secondary operations |
| Mold amortization | 5–10% | Mold cost ÷ total production volume |
| Packaging and logistics | 2–5% | Part size, stacking density, export packaging |
The leverage points are material and machine time — together accounting for 65–85% of the per-unit cost. A 10% cycle time reduction saves 2.5–4.0% of the per-unit cost. A 10% material reduction saves 4–6%. A 10% mold cost reduction saves 0.5–1.0%. The order of attack should follow the cost share.
Design Levers — The Geometry That Drives Cost
Wall Thickness — The Cycle Time Multiplier
Wall thickness is the single most powerful cost lever in injection molding because it controls the cooling time, and cooling time dominates the cycle time. Cooling time scales approximately with the square of wall thickness:
| Wall Thickness | Approximate Cooling Time | Relative Cycle Time | Relative Per-Part Cost |
|---|---|---|---|
| 1.5 mm | 8–10 s | 100% (baseline) | 100% (baseline) |
| 2.0 mm | 14–18 s | 125–140% | 110–120% |
| 2.5 mm | 22–28 s | 155–175% | 125–140% |
| 3.0 mm | 32–40 s | 190–220% | 150–170% |
| 4.0 mm | 55–70 s | 285–350% | 210–260% |
Reducing the nominal wall from 2.5 mm to 2.0 mm — if structurally adequate — reduces the cycle time by approximately 35–45% and the per-part cost by 20–30%. Before adding ribs or gussets to compensate for lost stiffness, the question is whether the original wall was over-designed for the application. Many parts carry a wall thickness that was chosen by convention (“we always use 2.5 mm for enclosures”) rather than by engineering analysis. The material selection decision also influences the minimum viable wall thickness: glass-filled materials can achieve equivalent stiffness at thinner walls than unfilled materials.
The wall thickness design guide covers the structural trade-offs; the cost reduction context adds the economic case. For the procurement engineer’s ABS enclosure, reducing the nominal wall from 2.5 mm to 2.0 mm — with targeted 1.2 mm ribs for stiffness — cuts the cooling time from 24 to 16 seconds and the total cycle time from 38 to 28 seconds. The per-unit machine time cost drops from ¥1.90 to ¥1.40. The part weight drops from 45 g to 38 g. Material cost drops from ¥0.81 to ¥0.68. Combined savings: ¥0.63 per part — nearly half of the ¥1.40 target, from one design change.
Material Selection — Price vs. Performance per Kg
The material price per kilogram is what procurement sees. The material cost per part is what matters — and it is determined by part volume, not part weight alone:
| Material | Price ($/kg) | Density (g/cm³) | Relative Cost per cm³ | Notes |
|---|---|---|---|---|
| PP (general purpose) | $2.00 | 0.91 | $0.0018 | Lowest cost per cm³ |
| ABS (general purpose) | $3.50 | 1.05 | $0.0037 | Baseline for comparison |
| PC | $5.00 | 1.20 | $0.0060 | 62% more than ABS per cm³ |
| PC/ABS | $4.50 | 1.14 | $0.0051 | 38% more than ABS per cm³ |
| PA6 (unfilled) | $4.00 | 1.14 | $0.0046 | Similar density, slightly higher cost |
| PA6 (30% GF) | $5.50 | 1.37 | $0.0075 | Higher density + higher price = 2× ABS |
| POM | $5.00 | 1.41 | $0.0071 | High density amplifies price |
| PEEK (unfilled) | $90.00 | 1.32 | $0.119 | 32× the cost of ABS per cm³ |
A material swap from PC to ABS saves on both price per kilogram and density. But the swap must be structurally valid — PC was presumably selected for a reason (impact resistance, heat deflection, transparency). The valid material cost reduction is not to substitute a cheaper material but to verify that the current material is not over-specified for the application.
Cavitation — The Economies of Scale
Adding cavities reduces the per-part machine time cost by dividing the press hourly rate across more parts per cycle. But it increases the mold cost and the press tonnage requirement:
| Cavities | Relative Mold Cost | Press Tonnage | Parts per Hour (at 30 s cycle) | Relative Machine Cost per Part |
|---|---|---|---|---|
| 1 | 100% (baseline) | Lowest | 120 | 100% |
| 2 | 150–180% | +10–20% | 240 | 50–55% |
| 4 | 220–280% | +20–40% | 480 | 28–35% |
| 8 | 350–450% | +40–60% | 960 | 15–22% |
| 16 | 550–700% | +60–100% | 1,920 | 8–13% |
The economic crossover — the point where the additional mold cost is justified by the per-part machine time savings — depends on the total production volume. For the procurement engineer’s 120,000 units per year:
| Cavities | Mold Cost (Est.) | Machine Cost/Part | Mold Amortization/Part (over 3 years) | Total Cost/Part |
|---|---|---|---|---|
| 2 (current) | ¥45,000 | ¥1.90 | ¥0.13 | ¥2.03 |
| 4 | ¥72,000 | ¥1.05 | ¥0.20 | ¥1.25 |
| 8 | ¥108,000 | ¥0.57 | ¥0.30 | ¥0.87 |
Moving from a two-cavity to a four-cavity mold increases the mold cost by ¥27,000 but reduces the machine cost per part by ¥0.85 — a payback period of approximately 32,000 parts, or roughly three months at 120,000 units per year.
Process Levers — The Machine Time Equation
Cycle Time Optimization
Cycle time breaks down into injection, pack/hold, cooling, and mold open/close/eject. Each phase has optimization potential:
| Phase | Typical Share | Optimization Levers |
|---|---|---|
| Injection | 5–10% | Injection speed, gate size, melt temperature |
| Pack/Hold | 10–20% | Gate freeze study; don’t over-pack |
| Cooling | 50–70% | Wall thickness, mold temperature, cooling channel design |
| Mold open/close/eject | 10–15% | Press speed settings, ejection stroke, robot integration |
The cooling phase dominates — and it is controlled primarily by part design (wall thickness), not by process settings. A conformal cooling system can reduce cooling time by 20–40% in deep-core or complex-geometry tools by bringing the cooling channels closer to the cavity surface. The conformal cooling insert cost is typically recovered in cycle time savings within 50,000–150,000 cycles, depending on the part geometry and the hourly press rate.
For the pack/hold phase, the most common waste is excess hold time. The gate-seal study described earlier identifies the minimum hold time that delivers a fully packed part — every additional second of hold time is machine time that adds cost without adding part quality. Reducing hold time from 10 seconds to 6 seconds (based on gate-seal data) on a 38-second cycle saves approximately 10% on the machine time component.
Automation — Reducing Labor Content
The labor component of per-part cost is small in high-wage automated factories (5–8%) and larger in manual operations (12–18%). Automation levers include:
- Sprue pickers and part removal robots: Eliminate the operator reaching into the press to remove parts. A basic pneumatic sprue picker ($2,000–4,000) reduces the operator’s per-cycle task to inspection and packing. A 3-axis servo robot ($15,000–25,000) removes the part, separates the runner, and places parts on a conveyor — eliminating the operator from the press-side entirely for simple parts.
- Auto-degating with submarine gates: Eliminates the manual trimming operation that edge gates require. The submarine gate design adds mold complexity but removes an operator task that consumes 3–8 seconds per part.
- In-line assembly and labeling: Integrating downstream operations into the molding cell — pad printing, ultrasonic welding, label application, packaging — reduces part handling and the associated labor and quality costs.
Hot Runner Economics
A hot runner system eliminates the cold runner, reducing the shot weight by the runner weight. The material saving is the primary justification:
| Parameter | Cold Runner (2-cavity) | Hot Runner (2-cavity) | Delta |
|---|---|---|---|
| Shot weight (per cycle) | 108 g (2 parts + runner) | 90 g (2 parts only) | −18 g (−17%) |
| Material cost per shot | ¥1.94 | ¥1.62 | −¥0.32 |
| Hot runner amortization per shot | — | ¥0.08 | +¥0.08 |
| Net saving per shot | — | — | −¥0.24 |
| Annual saving at 120,000 units | — | — | ¥14,400 |
At a hot runner cost of ¥25,000 for a two-drop system, the payback period is approximately 21 months — under two years of production. For materials above ¥30/kg (PC, glass-filled nylons, PBT), the payback is under 12 months because the runner waste is more expensive.
Tooling Levers — Mold Cost vs. Running Cost
Mold Steel Selection and Mold Life
A mold built from pre-hardened P20 (28–32 HRC) costs less than one built from hardened H13 (48–52 HRC) — approximately 20–30% less for the steel and machining. But P20 wears faster, particularly in high-cycle applications, and at parting lines, ejector bores, and gate areas. For a mold expected to run 500,000 shots over its lifetime:
| Steel | Mold Cost | Shots Before Refurbishment | Refurbishment Cost | Total Cost Over 500k Shots |
|---|---|---|---|---|
| P20 | ¥55,000 | ~150,000 (2 refurbishments) | ¥15,000 each | ¥85,000 |
| H13 (48 HRC) | ¥72,000 | ~500,000 (0 refurbishments) | — | ¥72,000 |
The less expensive mold steel costs more over the production lifetime because of the refurbishment cycles. For production volumes above approximately 200,000 shots, hardened steel is the lower total-cost option. Below 100,000 shots, pre-hardened steel is the cost-optimal choice.
Interchangeable Inserts
For parts with multiple variants that share a common geometry, interchangeable cavity inserts allow variant changes without building a new mold. A mold with a common core and interchangeable cavity inserts costs approximately 30–50% more than a single-variant mold — but each additional variant adds only the insert cost (typically ¥8,000–15,000 per insert set) rather than the full mold cost (¥45,000–72,000). At three or more variants, the insert approach is the clear economic winner.
Cost Reduction Checklist — Where to Look, in Order
| # | Check | Typical Saving | Effort |
|---|---|---|---|
| 1 | Reduce wall thickness to structural minimum | 10–30% | Design change; mold modification if existing tool |
| 2 | Add cavities (2→4, 4→8) | 15–35% machine cost per part | New mold required |
| 3 | Convert cold runner to hot runner | 10–20% material cost | Mold modification or new mold |
| 4 | Reduce hold time (gate-seal study) | 5–10% cycle time | Process change only |
| 5 | Switch from manual degating to auto-degating gates | 3–8% labor cost | Mold modification |
| 6 | Optimize cooling (conformal if justified) | 10–25% cycle time | When building new mold |
| 7 | Add part removal automation | 5–10% labor cost | Capital investment |
| 8 | Negotiate material price (volume commitment) | 3–8% material cost | Commercial negotiation |
| 9 | Verify material is not over-specified | 5–30% material cost | Requires engineering analysis and customer approval |
The procurement engineer with the ¥6.20 → ¥4.80 target achieved it through three changes: reducing the nominal wall from 2.5 mm to 2.0 mm with structural ribbing (¥0.63 saved), moving from a two-cavity to a four-cavity mold tool (¥0.78 saved on machine time, partially offset by ¥0.07 higher mold amortization), and switching from cold-runner edge gates to a hot-runner system with submarine gates (¥0.24 saved on material, ¥0.04 saved on degating labor). The combined savings of ¥1.54 exceeded the ¥1.40 target, delivering a per-unit cost of ¥4.66 — a 25% reduction, slightly better than the procurement target.
Cost reduction in injection molding is not about squeezing the material supplier or the molder for a lower margin. It is about designing the part and the process so that the material, the machine time, and the labor are consumed at the minimum viable level. The design decisions that drive cost are made before the mold is built — and the most expensive decision is the one that is never challenged.