Mold Flow Analysis Guide — How Simulation Reduces DFM Iterations
An engineer submits a part design for DFM review. The mold designer looks at the geometry and sees a problem: the wall thickness varies from 1.5 mm to 4.0 mm across the part, the gate location the engineer specified is on a cosmetic surface, and the ribs are deeper than the nominal wall by a factor of 2.5. The designer writes a DFM report identifying six issues. The engineer revises the design. The designer reviews again. Two weeks pass. The mold design is approved. Steel is cut.
T1 samples come back. The part has sink marks in three locations. The warp across the 200 mm length is 1.2 mm — the tolerance is ±0.3 mm. A weld line runs through a cosmetic surface that was supposed to be SPI A-2 gloss. The mold modifications cost $3,200 and delay T2 by 10 days.
Mold flow analysis would have predicted all three issues before the first electrode touched steel. It would have cost $400–800 and saved $3,200 in rework plus two weeks of schedule. This guide explains what mold flow analysis does, what it can and cannot predict, and when it is worth the investment.
1. What Mold Flow Analysis Simulates
Mold flow analysis — also called injection molding simulation, and commonly referred to by the dominant software brand Moldflow (Autodesk) — is a computer simulation that predicts how molten plastic will behave inside a mold cavity. It divides the part geometry into thousands of small elements (a mesh) and solves the equations of fluid flow, heat transfer, and material behavior for each element across the injection cycle.
A simulation report covers five areas:
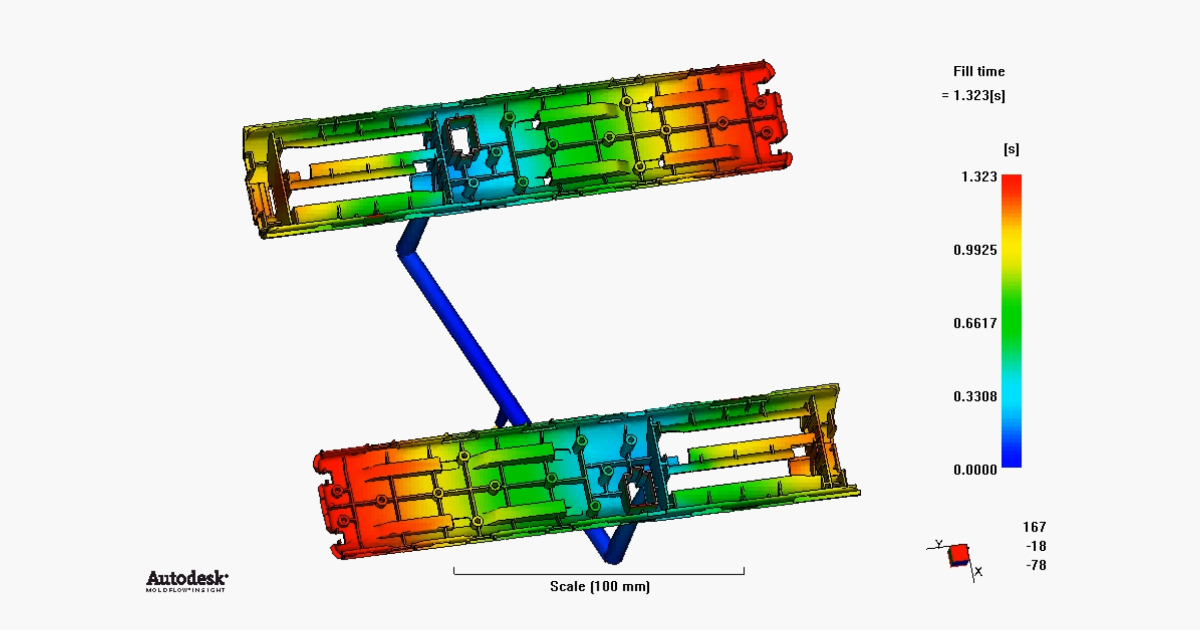
Fill Analysis
What it predicts: How the melt front advances through the cavity from the gate. Whether the cavity fills completely. Whether all cavities in a multi-cavity tool fill at the same rate. Where the melt front meets itself — creating a weld line.
What the output looks like: A color-coded animation showing the melt front advancing through the cavity over time, with fill time contours. A balanced fill shows all flow paths reaching the end of fill at approximately the same time. An unbalanced fill shows one area filling completely while another is still 40% empty — indicating a gate position problem or wall thickness imbalance.
Pressure and Clamp Force
What it predicts: The injection pressure required to fill the cavity at the specified fill time. The pressure distribution across the part. The clamp force required to keep the mold closed.
Why it matters: If the required pressure exceeds the press capacity, the mold cannot run on the intended machine. If the pressure distribution is uneven, some areas of the cavity are overpacked (flash, stress, sticking) while others are underpacked (sink, dimensional variation). The simulation tells you whether your part geometry is compatible with your available press tonnage.
Weld Line Prediction
What it predicts: Where melt fronts meet and form weld lines. The temperature of the melt at the meeting point — which determines weld line strength.
Why it matters: A weld line on a non-structural, non-cosmetic surface is acceptable. A weld line across a snap-fit arm is a failure point waiting to happen. A weld line on an SPI A-2 gloss surface is visible and unacceptable. The simulation shows you where weld lines will form before the mold is built, so you can move the gate, adjust wall thickness, or relocate cosmetic surfaces accordingly.
Air Traps and Venting
What it predicts: Where air becomes trapped as the melt front converges. Locations that will produce burn marks or short shots if not vented.
Why it matters: Air traps that the simulation identifies can be addressed by adding vents at those locations in the mold design. Vents cost almost nothing during mold manufacturing — a shallow groove ground into the parting line. Adding vents after the mold is built requires the tool to come out of the press and go back to the toolroom. The simulation prevents the second scenario.
Cooling and Warpage
What it predicts: How the part cools after filling. The temperature distribution at ejection. The residual stresses from differential cooling. The resulting warpage — how much the part will distort from the as-molded shape after ejection and cooling to ambient temperature.
Why it matters: Warpage is the most expensive post-T1 correction. It is caused by differential shrinkage — one area of the part cools and shrinks faster than another, creating internal stresses that distort the part. The simulation predicts warpage magnitude and direction. If the predicted warp exceeds the drawing tolerance, the mold designer can add cooling channels, adjust wall thickness, or modify the gate location before steel is cut.
2. When Mold Flow Analysis Pays for Itself
Mold flow analysis is not free. A typical simulation for a single-cavity part costs $400–800 and takes 1–3 days depending on complexity and the analyst’s workload. For a complex multi-cavity tool with sequential valve gating, the cost can reach $1,200–2,000.
The question is not whether simulation is “worth it” in the abstract. It is whether the cost of the simulation is less than the expected cost of the mold modifications it prevents.
| Scenario | Simulation Cost | Risk Without Simulation | Verdict |
|---|---|---|---|
| Simple part, uniform wall thickness, single gate, unfilled PP | $400–600 | Low — geometry is forgiving | Optional. Simulation adds confidence but unlikely to prevent rework |
| Part with 2:1 wall thickness variation, multiple bosses and ribs, glass-filled material | $500–800 | High — sink, warp, and weld line risk | Recommended. One avoided T1 rework pays for 4× the simulation cost |
| Multi-cavity tool (8+ cavities), tight cavity balance requirement | $800–1,500 | Very high — cavity imbalance causes dimensional variation across cavities | Essential. Fixing runner balance after the mold is built requires re-cutting the runner |
| Cosmetic part with A-grade surface, gate on visible surface | $600–900 | Medium — gate vestige and weld line risk on cosmetic surface | Recommended. Gate location changes after mold build are expensive |
| Part with long flow length relative to wall thickness (>200:1 L/t ratio) | $500–800 | High — risk of short shot or excessive pressure | Recommended. Simulation confirms fill feasibility before tooling commitment |
The rule of thumb: if the mold costs more than $10,000, run a mold flow analysis. The simulation cost is 4–8% of the tooling investment and prevents modifications that typically cost 10–25% of the tooling cost. The math is straightforward: a $600 simulation on a $15,000 mold that prevents one $3,000 modification has a 5:1 return.
3. What Simulation Cannot Predict
Mold flow analysis is not a guarantee. It is a model, and every model has limitations.
It cannot predict material batch variation. The simulation uses the material supplier’s published data for viscosity, specific heat, thermal conductivity, and PVT behavior. Real resin lots vary within the supplier’s specification range. A process that simulates perfectly on the published data may run at the edge of the process window on a particular material lot.
It cannot predict mold manufacturing variation. The simulation assumes the cavity dimensions are exactly as modeled. Real cavities are machined to a tolerance — typically ±0.01–0.02 mm for critical dimensions. The simulation does not account for this variation.
It cannot predict operator-dependent process drift. The simulation models the process at nominal settings. It does not model a setup technician increasing the hold pressure at 3 AM because the previous lot was slightly more viscous.
It is only as good as the mesh. A coarse mesh produces fast but approximate results. A fine mesh produces accurate results but takes longer to solve. The analyst must choose the mesh density appropriate for the geometry — and a poor mesh choice produces misleading results.
These limitations do not make simulation useless. They make it a decision-support tool, not a decision-replacement tool. The simulation tells you where the risks are. It does not guarantee the risks will materialize — or that no other risks exist.
4. Reading a Simulation Report
A mold flow analysis report typically runs 20–50 pages. The three pages that matter most:
Fill time plot. Look for: does the fill time vary by more than 10% across flow paths? If so, the cavity is unbalanced — some areas fill much faster than others, creating uneven pressure distribution and potential short shots.
Weld line map. Look for: weld lines on structural features (snap arms, boss roots), weld lines on cosmetic surfaces, and weld line temperature below the material’s recommended processing temperature. Cold weld lines are weak.
Warpage plot. Look for: maximum deflection exceeding the drawing tolerance by more than 50%. If the simulation predicts 0.6 mm warp on a ±0.3 mm tolerance, the part will warp in production. If it predicts 0.2 mm, the margin is too thin — the real world will push it over.
If these three plots look acceptable, the mold design is probably sound. If any of them shows a problem, address it in the design before cutting steel. The simulation has done its job.
5. Simulation vs. Trial-and-Error: The Real Cost
A comparison of two approaches to the same part — a PA66-GF30 automotive bracket, 180 × 120 × 40 mm, 2.5 mm nominal wall, single cavity:
| With Simulation | Without Simulation | |
|---|---|---|
| Simulation cost | $650 | $0 |
| Mold design time | 5 days (fewer iterations) | 8 days (three DFM revision cycles) |
| Mold build time | 4 weeks | 4 weeks |
| T1 outcome | Minor gate vestige — accepted | Sink on three bosses, warp 0.8 mm, weld line on snap arm |
| T1 corrections | None | Re-cut gate, add cooling channel, relocate gate — $3,200 |
| T2 timeline | On schedule | +2 weeks |
| Total cost | $650 | $3,200 + 2 weeks |
The simulation cost $650 and prevented $3,200 in rework. The two-week schedule slip is harder to quantify but often more expensive than the rework itself — a delayed product launch, an idle assembly line, an expedited shipment.
Mold flow analysis is an insurance policy on the mold design. It costs 4–8% of the tooling investment and pays out when it prevents a mold modification that costs 10–25% of the tooling investment. The payout is not guaranteed — a simple part in an experienced mold designer’s hands may not need simulation. But the premium is small relative to the coverage, and the claims rate is high enough that skipping simulation on a production mold is a bet, not a decision.