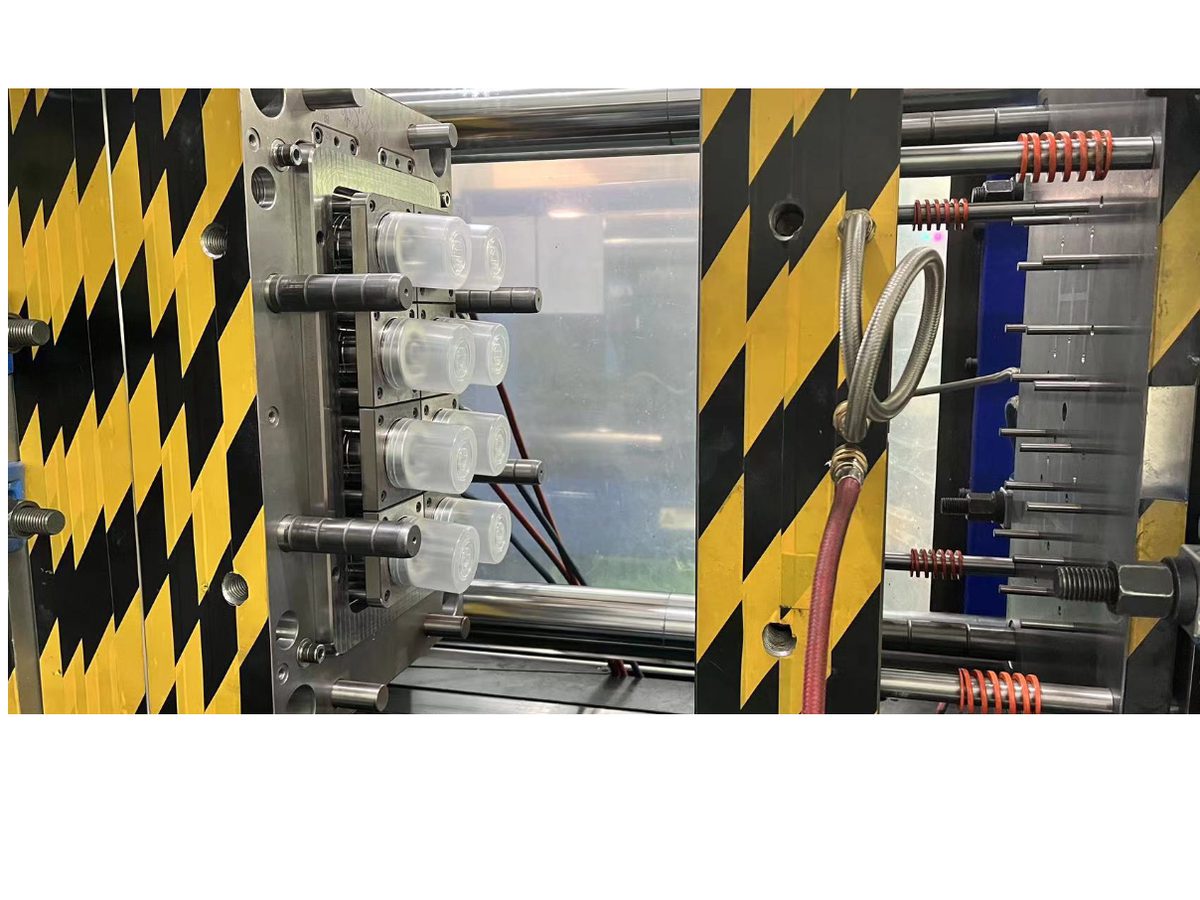
How to Reduce Injection Molding Cost at 500K+ Parts/Year
A program manager needs 10% out of the piece price on a housing running 600,000 pieces per year. The supplier’s response to the request is a 2% “loyalty discount” and a reminder about resin price increases. Neither side is wrong — the supplier’s margin is already thin, and the buyer’s target is real. The 10% exists, but it is not in the negotiation. It is in the cycle time, the cavity count, the runner system, and the material buy — the levers that only become available once a program passes roughly half a million pieces per year.
At 500K+ pieces per year, the cost structure of injection molding inverts. Tooling, which dominated the economics at 5,000 pieces, amortizes to fractions of a cent per part. Cycle time and material — trivial line items on a prototype invoice — become 80% of the piece cost. The cost-reduction playbook for volume production is therefore completely different from the one for low-volume programs. This post covers the levers, ranked by impact, with the math to evaluate each one.
If you need the fundamentals first, start with the injection molding cost breakdown and the design-side cost reduction strategies. This post covers what changes specifically at volume.
Where the Money Goes at 500K+ Pieces
At volume, three numbers dominate the piece price, and every legitimate reduction lever attacks one of them:
Material — typically 50–70% of the piece cost. Once tooling is amortized, the resin is the single largest line item. At 600,000 parts per year, a 1% material saving is worth more than most tooling optimizations.
Machine time — driven by cycle time and cavity count. A press has a fixed hourly cost: energy, operator time, floor space, and the depreciation of the machine itself. Every second of cycle time and every cavity added or removed changes how many parts share that hourly cost. Cooling alone typically represents 60–80% of the total cycle.
Tooling amortization — small but not zero. At 500K pieces per year on a production tool, amortization runs a few cents per part. It still matters in the first year, and it matters enormously if the tool is underspecified and fails early — see mold maintenance and tool life.
Everything else — labor, overhead, packaging — is small at volume if the process is automated. On a press with automated part removal, direct labor per part is measured in tenths of a cent. This is why the levers below focus on material, cycle time, and cavitation rather than “cheaper labor.”
Lever 1 — Cycle Time (Highest Impact, Zero Per-Part Risk)
Cycle time is the highest-leverage variable at volume because it costs nothing per part and compounds forever. A 25-second cycle at 600,000 parts per year is 4,167 machine-hours. Cutting the cycle to 22 seconds saves 500 machine-hours per year — 12% of the press capacity the program consumes, every year, for the life of the program.
The levers that reduce cycle time, in order of typical impact:
Cooling time — the dominant element. Cooling is 60–80% of the total cycle for most parts. Conformal cooling channels — machined or printed to follow the part contour rather than drilled straight — cut cycle time 20–40% on thick or complex parts. The investment is in the mold insert, paid back in months at 500K+ volumes. See the conformal cooling guide and cooling system design.
Wall thickness — the multiplier. Cooling time scales roughly with the square of wall thickness. A part designed at 3.0mm cools in about 2.25× the time of the same part at 2.0mm. At volume, wall thickness is a cycle-time decision as much as a strength decision. See wall thickness design guide.
Hot runner — removes the thickest section. The sprue and cold runner are often the thickest sections in the mold, and the cooling time is governed by the thickest section. A hot runner removes the sprue entirely and can shorten the cycle by several seconds in addition to the material saving covered in Lever 4.
Ejection and part removal. A fast, reliable ejection sequence and automated part removal let the mold open, drop, and close without hesitation. Automated removal on 80% of our press fleet is one of the quiet contributors to cycle discipline.
The evaluation math: every second of cycle time at 600,000 parts per year is worth 167 machine-hours annually. Compare that against the cost of the change — a conformal insert might cost $3,000–8,000 and save 3–5 seconds. Payback is measured in months.
Lever 2 — Cavitation (The Multiplication Effect)
Cavity count divides the machine time per part. An 8-cavity tool at a 25-second cycle produces 1,152 parts per hour; the same part in a single-cavity tool produces 144. The 8-cavity part costs roughly one-eighth of the machine time — the single biggest discrete jump in piece cost available at volume.
The cavitation decision is a balance:
- Higher cavitation cuts machine time per part — but requires more clamp force, better runner balancing, and a bigger tool investment.
- Cavity balance determines quality. A 16-cavity tool with poor balance produces 16 different parts. Our published Type-C charger housing runs 16 cavities with Cpk 1.52 on cavity weight balance — the standard a production tool should meet. See multi-cavity and family molds for the full trade-off set.
- Cycle time and cavitation interact. An 8-cavity tool at 25 seconds and a 4-cavity tool at 18 seconds produce nearly the same hourly output. The DFM decision is which combination fits the press fleet and the tooling budget — and the answer should be calculated, not guessed.
The math to run before quoting: parts per hour = cavities × (3,600 ÷ cycle time). Then divide the machine hourly cost by that number. The result is the machine-time component of your piece price, and any supplier should be able to produce this calculation for your program.
Lever 3 — Material (The Biggest Line Item, The Most Negotiable)
At 50–70% of the piece cost, material deserves more attention than it usually receives. The levers:
Volume pricing. Resin pricing is tiered by quantity. A program buying 40 tonnes per year should not pay the same per-kg rate as one buying 400 kg. Ask the supplier to pass through volume breaks — and verify with the resin supplier’s published tier structure. A supplier stocking 500+ grades with multi-source purchasing has the leverage to negotiate; one buying single-bag quantities does not.
Regrind where the specification allows. For non-cosmetic, non-structural parts, running 10–30% regrind of the same material cuts the effective material cost proportionally. The constraint is your specification — regrind affects mechanical properties and cosmetics, so it belongs in the DFM discussion, not in a quiet unilateral decision by the molder.
Grade rationalization. If three parts in your product family run three different ABS grades, consolidating to one grade multiplies the purchase volume on that grade and deepens the pricing tier. The engineering cost is re-validation; at volume, the material saving usually pays for it within a year.
Moisture and handling loss. Improperly dried resin produces splay and scrap. Material handled correctly — sealed, dried to spec, lot-tracked — is material that does not become scrap. This is a control lever, not a price lever, but it is worth real money at volume.
The discipline on material is traceability: the resin lot on the certificate should be the lot that molded your parts. See the quality control guide for what lot traceability looks like in practice.
Lever 4 — Hot Runner Systems (Material + Cycle Time Together)
A cold runner system turns 15–30% of every shot into a sprue and runner that get reground, transported, and reprocessed — or scrapped. A hot runner eliminates the sprue entirely and keeps the melt hot in the manifold between shots.
At 600,000 parts per year, the economics are decisive:
- Material saved: the sprue percentage of shot weight, times annual volume, times resin price — for a 40g part with a 12g sprue in ABS, that is roughly 7 tonnes of resin per year that stops being waste.
- Cycle time saved: the sprue is usually the thickest section; removing it shortens the cooling-limited cycle by seconds.
- Investment: hot runner systems (Yudo, Mold-Masters, Husky, Synventive) add cost to the tool and complexity to maintenance. The payback at 500K+ volumes is typically under one year.
The comparison framework is in the hot runner vs cold runner guide. The volume threshold where hot runners almost always win is exactly the one this post is about.
Lever 5 — Automation (Removes Labor From the Piece Price)
At volume, direct labor is the cost that should trend to zero per part. The components:
- Automated part removal — robots or sprue pickers on the press. A press running automated removal needs an operator for material loading and monitoring, not for the molding cycle itself.
- In-process inspection — vision systems and automated gauging catch defects at the machine instead of at a manual sorting station downstream.
- Packaging and palletizing — at 500K+ pieces, manual packing becomes a real line item; semi-automated packing amortizes quickly.
The audit question for a volume supplier: what percentage of presses run automated part removal? If the answer is “most of them,” labor is already engineered out. If the answer is “we have skilled operators,” you are paying for labor that automation has made unnecessary — and every other customer of that supplier is too.
The Commercial Levers
Three cost levers live in the contract, not the process:
Amortization schedule. Tooling cost can be spread over the first year of production, amortized per part, or bought outright. Each structure changes the first-year piece price. At 500K+ pieces, a per-part amortization spread over 12 months keeps launch cash flow clean — and the schedule should be in writing.
Tool life as a cost plan. A production tool specified in H13 (48–52 HRC, 500K–1M+ shots) or 2344 (800K–1M+) costs more than P20 up front and less per part over its life. The tooling decision is a total-cost-of-ownership calculation, not a purchase price comparison — see mold maintenance and tool life.
Logistics and inventory. Full-container shipments instead of partials, consolidated packaging, and consignment/Kanban supply cut the landed cost and the working capital tied up in inventory. A supplier that holds finished goods and ships on call-off removes your forecasting error from the supply chain — a cost you are otherwise paying as safety stock.
What NOT to Do at 500K+
Every volume program hears these three ideas. Each is a cost trap dressed as a saving:
Downgrading the tool steel to save tooling cost. Saving $3,000 on P20 instead of H13 for a 2-million-shot program buys $50,000 of downtime and repairs over the tool’s life. The tooling buy is the wrong place to save at volume.
Substituting material without re-validation. Switching grades saves money until the parts fail — in the field, in your customer’s product. Any substitution goes through testing and customer approval first, or the “saving” is a liability.
Splitting volume across suppliers to keep them competitive. Two suppliers at 300K pieces each get worse pricing, worse attention, and twice the tooling and qualification cost than one supplier at 600K. Volume is leverage — concentrate it.
The Lever Summary
| Lever | Typical Impact | Investment | Payback at 500K+/yr | Risk |
|---|---|---|---|---|
| Conformal cooling | Cycle −20–40% | Mold insert | Months | Low, if DFM is sound |
| Wall thickness reduction | Cooling time scales ~square | Design change + re-validation | Months | Requires engineering review |
| Added cavities | Machine time ÷ cavities | Tool investment | Year one | Clamp force, balance |
| Hot runner | Material −15–30%, cycle −seconds | Tool investment | Under one year | Maintenance complexity |
| Volume resin pricing | 5–10% of material cost | None | Immediate | Requires volume commitment |
| Regrind where allowed | Material cost −10–30% | Validation | Immediate | Specification constraints |
| Automation | Labor → tenths of a cent/part | Equipment | Year one–two | Only at volume |
| Amortization structure | First-year cash flow | None | Immediate | Contract clarity |
Frequently Asked Questions
At what volume do these levers start to pay? Most of them pay at 500K+ pieces per year, which is why the threshold is in the title. Hot runners and conformal cooling pay back under a year at that volume; below 100K pieces per year the same investments often do not justify themselves.
How much can cycle time realistically be reduced? Conformal cooling on thick or complex parts: 20–40%. Hot runner sprue removal: seconds per cycle. Wall thickness redesign: proportional to the square of thickness. A 25-second cycle down to 20 seconds is a realistic combined target for a part designed without volume optimization.
Does adding cavities always reduce piece cost? Almost always at volume, but with two checks: the press must have the clamp force, and the runner balance must hold cavity-to-cavity consistency. An 8-cavity tool with 8% weight spread between cavities produces parts that do not interchange — the piece-cost saving is consumed by quality problems.
How do I verify the supplier’s cycle time claim? Ask for the trial data: shot log, cycle time, injection pressure, and temperatures from the tool trial. That data is your production baseline. A supplier who cannot produce it has no baseline — see supplier qualification.
Should I buy the tool outright or amortize it per part? Depends on your cash flow and the relationship. Amortizing per part keeps launch cash clean and keeps the supplier’s interest in tool performance; buying outright gives you portability. Either way, tool ownership and the amortization schedule go in the contract before production starts.
What is a realistic total cost reduction at 500K+? A program that has never been volume-optimized typically finds 10–20% across the levers above — cycle time and material doing most of the work. A program already optimized is fighting for 2–3% per year. The difference between the two is whether the engineering happened before the tool was cut.
The Cost Question in One Line
At 500K+ pieces per year, the piece price is decided on the shop floor, not at the negotiating table: seconds of cycle time, cavity counts, runner systems, and the material buy — each with the math to prove it.
Review our high-volume manufacturing economics — 27 presses, multi-cavity tooling, and published programs from 280K to 50M+ pieces per year — or submit your part for a volume cost analysis.